Data Science for Business Applications
The limitations of RCTs
Although they are powerful for inferring causation, RCTs are hard to pull off:
They can be incredibly expensive (e.g., Phase 3 clinical trial)
Compliance with the treatment protocol isn’t perfect
It can be hard to generalize beyond the participants involved in the study, if they aren’t representative.
They can be impractical (e.g., effect of education on later earnings) or even unethical (e.g., seatbelts, parachutes, even medical trials)
Quasi-and natural experiments
Key idea: Find a comparison group that is effectively “the same as” the treatment group to create a “quasi-experiment”a or “natural experiment”a
Causal Question: Does serving in the military have an impact upon your long-term earnings after discharge?
Why won’t this work: Compare the wages of people who served in the US military in Afghanistan or Iraq, 10 years after discharge, to wages of the general public
The effect of military service on earnings
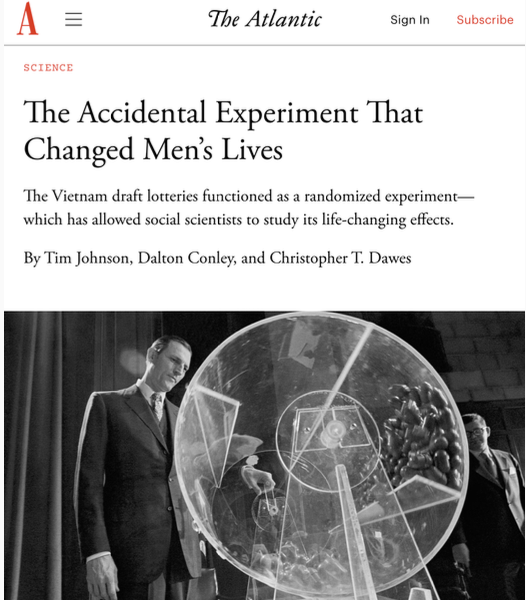
Angrist (1990) wanted to determine what effect military service had on future earnings
“Treatment” group: men selected by lottery to serve in Vietnam
“Control” group: men eligible to be drafted but not selected to serve
We effectively have (almost) random assignment
This is called a “natural” experiment because we have “discovered” what is nearly an RCT out “in the wild”!
For white men, earnings in the 1980s were 15% lower in the treatment group; military service in Vietnam really did cause those serving to have less earning power long-term
Quasi-and natural experiments
- These are called quasi-experiments or natural experiments because participants are not randomly assigned to treatment and control groups, but groups are selected in such a way that the assignment can be thought of as effectively random.
Difference-in-differences
A natural experiment of the minimum wage
What happens if we raise the minimum wage?
Economic theory says there should be fewer jobs.
Why can’t we just compare the unemployment rate in places with a low minimum wage (e.g., Texas) to places with a high minimum wage (e.g., California)?
Why can’t we just do a randomized controlled trial to study the impact of raising the minimum wage?
Difference-in-differences
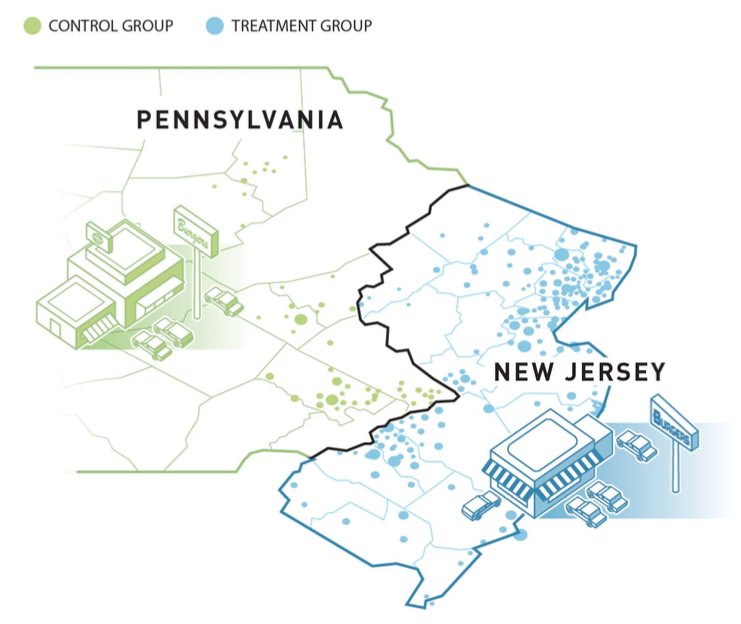
In 1992, New Jersey’s minimum wage went from $4.25 to $5.05
The minimum wage in Pennsylvania remained at $4.25
Researchers measured employment at 410 fast food restaurants in NJ and PA both before and after the change
This is a “natural” experiment because the two groups arose naturally (rather than being assigned by the researchers)
Difference-in-differences
Pre vs post comparison
| Before | After | Difference | |
|---|---|---|---|
| New Jersey | 20.44 | 21.03 | 0.59 |
Employment went up by 0.59 employees per store in NJ. Can we interpret this as a causal effect?
We cannot distinguish the effect of the minimum wage increase from other things that changed in NJ at the same time.
NJ vs PA comparison
| After | |
|---|---|
| Pennsylvania | 21.17 |
| New Jersey | 21.03 |
| Difference | −0.14 |
After the policy change, employment was 0.14 employees per store less in NJ than in PA. Can we interpret this as a causal effect?
We cannot distinguish the effect of the minimum wage increase from other differences between PA and NJ.
Difference-in-differences
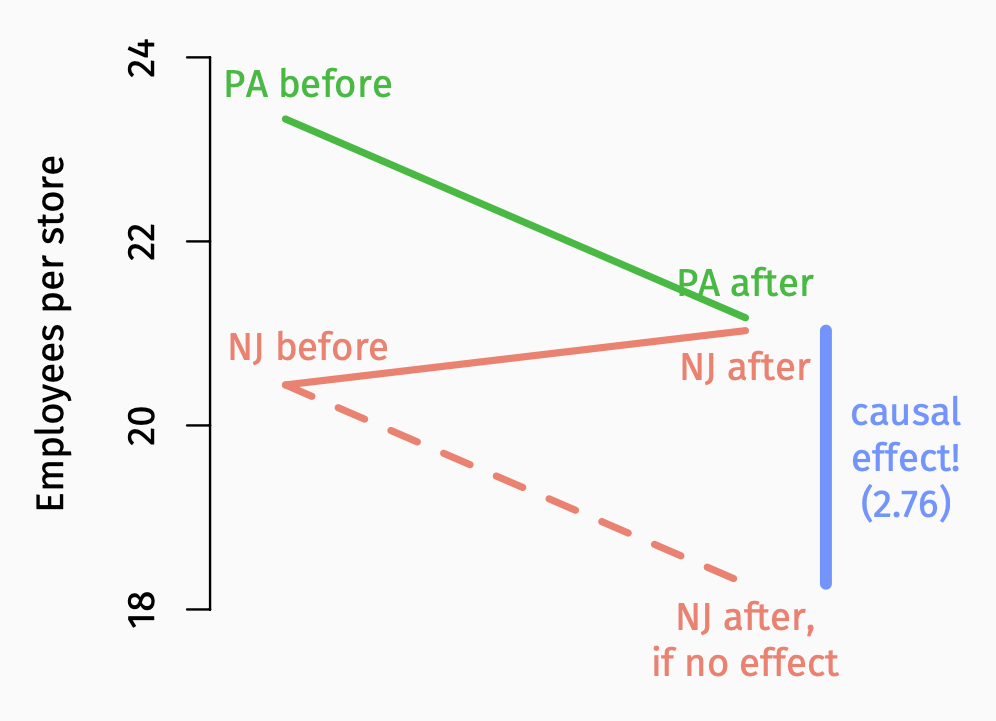
| Before | After | Difference | |
|---|---|---|---|
| Pennsylvania | 23.33 | 21.17 | -2.16 |
| New Jersey | 20.44 | 21.03 | 0.59 |
| Difference | -2.89 | -0.14 | 2.76 |
- The difference of the differences (−0.14 − (−2.89) or 0.59 − (−2.16)) gives us the causal effect of the policy change.
Difference-in-differences
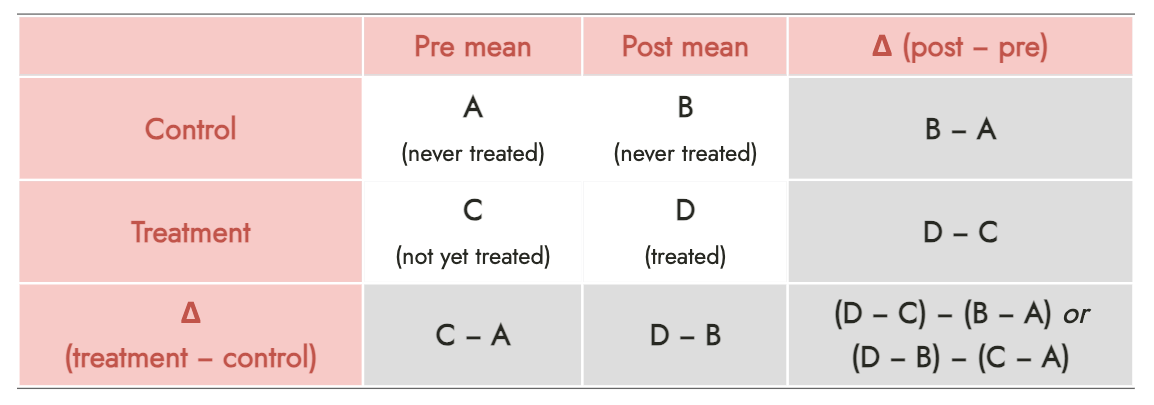
Difference-in-differences
- Difference-in-differences framework
Difference-in-differences
Why can’t we just compare college attainment of students who were and were not offered financial aid?
In 1982, the US government ended a program that provided $6,700 in financial aid to students whose parents were deceased.
We can therefore compare college attainment among four groups to get a natural experiment of the impact of financial aid:
Students with deceased parents, before 1982
Students with deceased parents, after 1982
Students without deceased parents, before 1982
Students without deceased parents, after 1982
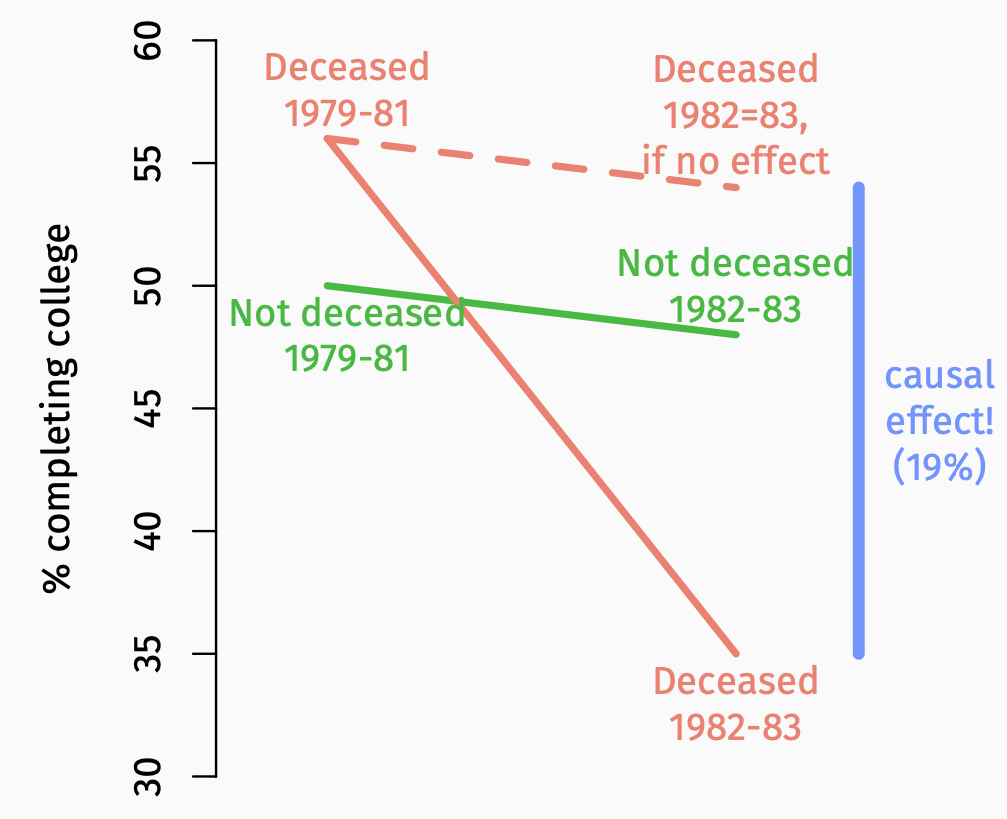
Difference-in-differences
What is the impact of financial aid on degree attainment?
| 1979-81 | 1982-83 | Difference | |
|---|---|---|---|
| With deceased parents | 56% | 35% | 21% |
| Without deceased parents | 50% | 48% | 2% |
| Difference | 6% | -13% | 19% |
- The $6,700 in financial aid led to a 19-percentage point increase in college attainment.
Difference-in-differences
Diff & Diff in Regression
We can also do the difference-in-differences calculation using regression. If we set: \[ T = \begin{cases} 1, & \text{for stores in New Jersey (treatment)} \\ 0, & \text{for stores in Pennsylvania (control)} \end{cases} \]
and
\[ X = \begin{cases} 1, & \text{for measurements after the policy change (post)} \\ 0, & \text{for measurements before the policy change (pre)} \end{cases} \]
Then we can fit the same regression discontinuity model with interaction. \[ \widehat{Y} = \widehat{\beta}_0 + \widehat{\beta}_1X + \widehat{\beta}_2T + \widehat{\beta}_3T\cdot X \] The coefficient \(\widehat{\beta}_3\) of \(T\) is the causal effect we’re looking for!
Assumptions
Parallel Trends
In the absence of the intervention, treatment and control group would have changed in the same way
Natural experiments
Ways to create natural experiments
Geographic boundaries (e.g., NJ vs PA minimum wage example)
Policy changes (e.g., financial aid policy change example)
Lotteries (e.g., Vietnam draft lottery example)
Arbitrary cutoffs
![]()