| Status | Age | Other_Credit |
|---|---|---|
| Bad | 30 | Yes |
| Bad | 22 | Yes |
| Bad | 28 | No |
| Bad | 24 | No |
| Bad | 30 | No |
| Bad | 26 | No |
| Bad | 26 | Yes |
| Bad | 28 | No |
Data Science for Business Applications
Class 07 - Logistic regression
Quick review of our Class
This is what we covered in previous classes:
Simple and Multiple Regression
Categorical Variables and Interactions
Residual Analysis
Time Series
Model Selection
Today we will introduce a new model.
The Banco data set
- The
bancodata set contains information about 100 customers of a bank that extends lines of credit. - We have data on customer age, number of dependents, sex, years in current job, years in current home, other lines of credit, and whether the account is in good standing.
- Let’s see if we can predict the
Statusof the account based on the customer’sAge. (In this data set, every account is classified as Good or Bad.)
Let’s build the model
- What’s wrong with this regression?
\[ \widehat{\text{Status}} = \widehat{\beta}_{0} + \widehat{\beta}_{1} \cdot \text{Age} \]
- The \(Y\) variable here is categorical (two levels—every account in this data set is either labeled
GoodorBad), so regular linear regression won’t work here. - But what if we just do it anyway?
Binary Variable
- Let’s first create a dummy variable
Badto convert Status to a quantitative dummy variable:
- We could do this with 1 representing either Bad or Good (it wouldn’t matter). Here it makes sense to use 1 for
Bad, since that is the outcome the bank wants to predict.
Regular Linear Regression
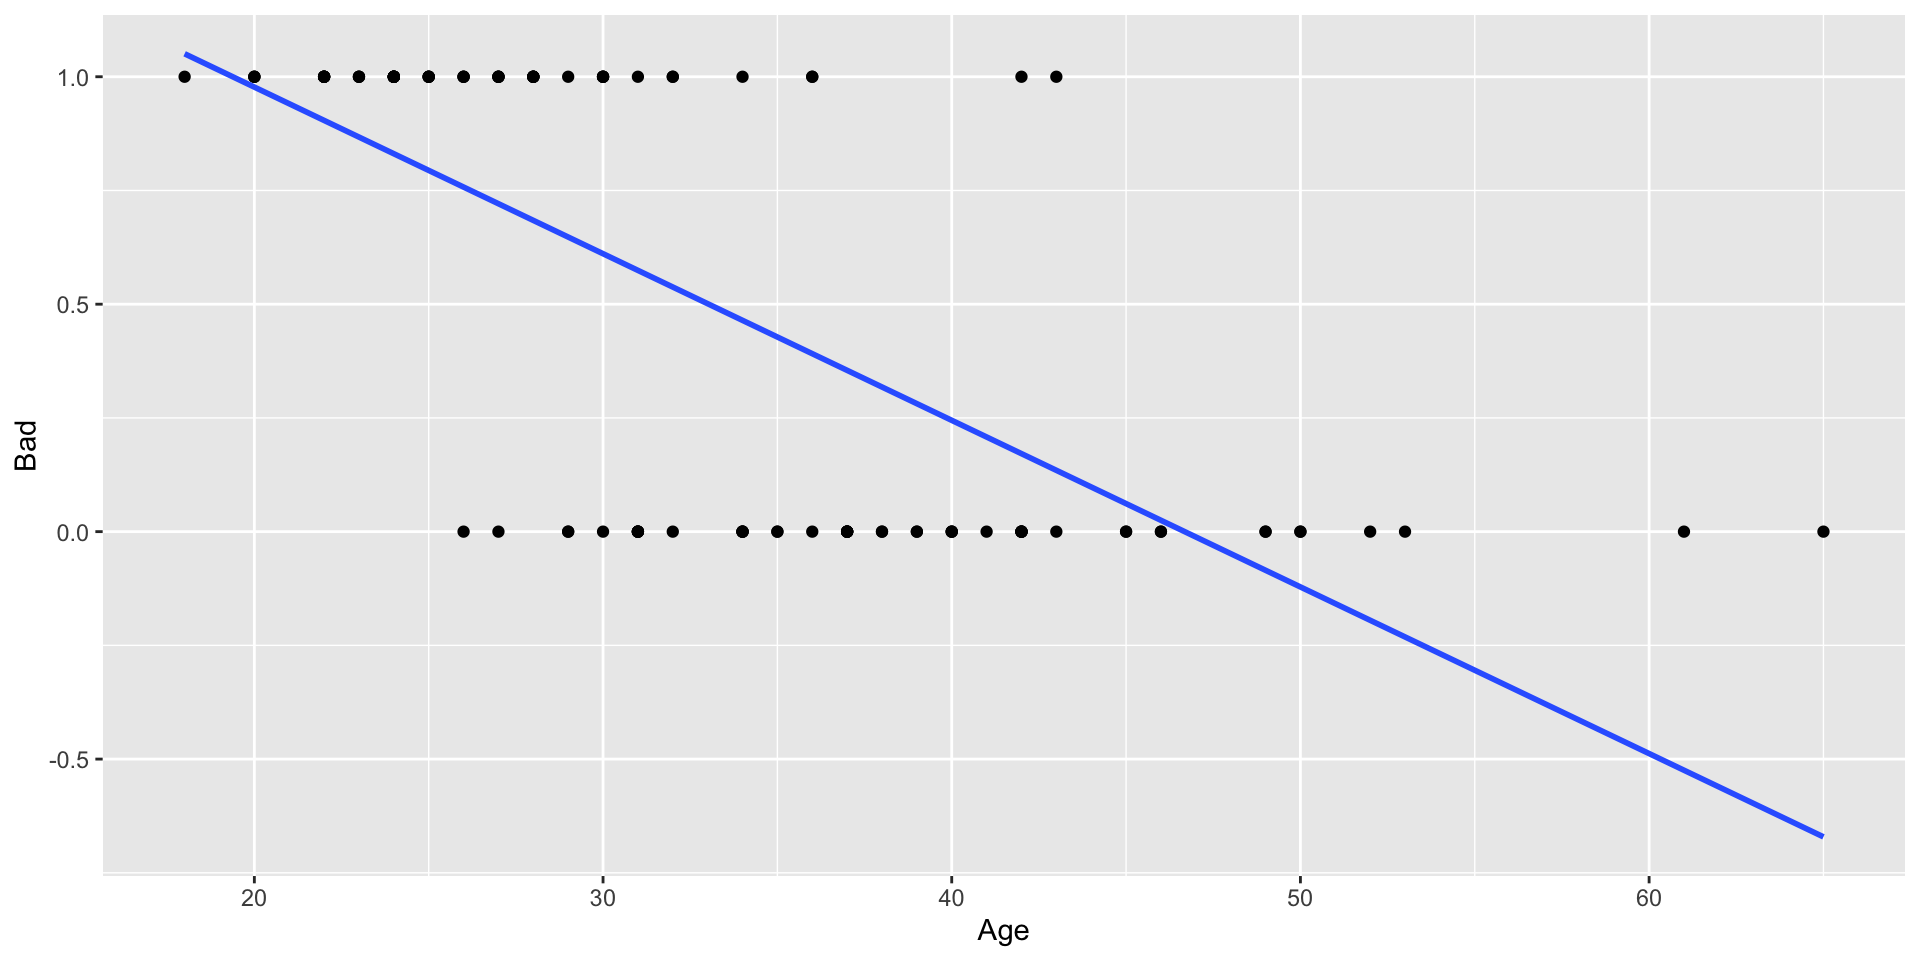
- A line is not a great fit to this data—it’s not even close to linear. And what does it mean to predict that
Bad= 0.7 (or 1.2)?
Logistic Regression
Instead of predicting whether an account is Bad, let’s predict the probability that it is Bad
In logistic regression, one level of \(Y\) is always called “success” and the other called “failure.” Since \(Y = 1\) for Bad accounts, in our setup we have designated Bad status as “success.” (You could also set \(Y = 1\) for Good accounts and call Good status “success.”)
Let’s fit a curve that is always between 0 and 1.
Odds and Probabilty
To fit the Logistic regression model we need to know the difference between odds and probability and how they relate.
When something has “even (1/1) odds,” the probability of success is 1/2.
When something has “2/1 odds,” the probability of success is 2/3.
When something has “3/2 odds,” the probability of success is 3/5.
In general, the odds of something happening are \(p/(1 − p)\).
Where \(p\) is the probability defined bewteen zero and one.
You can transform odds to probability: \[ \text{Odds} = \frac{3}{2} = \frac{3/(3+2)}{2/(3+2)} = \frac{3/5}{2/5} = \frac{p}{1-p} \]
If the odds are between zero and one they are not in your favor, \((1-p)>p\)
Let’s the explore this relation!
Probability vs odds vs log odds
| Probability \(p\) | Odds \(p/(1 − p)\) | Log odds \(\log(p/(1 − p))\) |
|---|---|---|
| 0 | 0 | \(-\infty\) |
| 0.25 | 0.33 | −1.10 |
| 0.5 | 1 | 0 |
| 0.75 | 3 | 1.10 |
| 0.8 | 4 | 1.39 |
| 0.9 | 9 | 2.20 |
| 0.95 | 19 | 2.94 |
| 1 | \(\infty\) | \(\infty\) |
- Probability is between zero and one.
- Odds are strictly positive (greater than zero).
- Log odds ranges the whole real line.
The logistic regression model
Logistic regression models the log odds of success \(p\) as a linear function of \(X\): \[ \log\left(\frac{p}{1-p}\right) = \beta_0 + \beta_1 \cdot X + e \]
This fits an “S-shaped” curve to the data
We’ll see what it looks like later
By making this choice, we have a series of benefits.
Let’s try it!
The logistic regression model
- We need a different function -
glm()(generalized linear models)
Call:
glm(formula = Bad ~ Age, family = binomial, data = banco)

Coefficients:
            Estimate Std. Error z value    Pr(>|z|)
(Intercept) 10.11768    1.92486   5.256 0.000000147 ***
Age         -0.31772    0.06107  -5.203 0.000000196 ***
---
Signif. codes:  0 '***' 0.001 '**' 0.01 '*' 0.05 '.' 0.1 ' ' 1

(Dispersion parameter for binomial family taken to be 1)

    Null deviance: 138.629  on 99  degrees of freedom
Residual deviance:  71.861  on 98  degrees of freedom
AIC: 75.861

Number of Fisher Scoring iterations: 6- How ca we interpret this model?
The logistic regression model
The logistic regression output tells us that our prediction is \[ \log(\text{odds}) = \log\left(\frac{\widehat{p(\text{Bad})}}{1-\widehat{p(\text{Bad})}}\right) = 10.12 -0.32 \cdot \text{Age} \]
To get the probability we have to solve in terms \(\widehat{p(\text{Bad})}\)
The probability of having a
Badstatus givenAge: \[ \widehat{p(\text{Bad})} = \frac{\exp(10.12 -0.32 \cdot \text{Age})}{1+ \exp(10.12 -0.32 \cdot \text{Age})} \] where \(\exp()\) is the exponential function \(e^x\).
Let’s show this
Let \(\widehat{p} = \widehat{p(\text{Bad})}\), and \(\exp(X\widehat{\beta}) = \exp(10.12 -0.32 \cdot \text{Age})\):
\[ \begin{eqnarray} \log\left(\frac{\widehat{p}}{1-\widehat{p}}\right) &=& X\widehat{\beta} \\ \exp\left(\log\left(\frac{\widehat{p}}{1-\widehat{p}}\right)\right) &=& \exp(X\widehat{\beta}) \\ \frac{\widehat{p}}{1-\widehat{p}} &=& \exp(X\widehat{\beta})\\ \widehat{p} &=& \exp(X\widehat{\beta})\cdot (1-\widehat{p})\\ \widehat{p} &=&\exp(X\widehat{\beta}) - \exp(X\widehat{\beta}) \cdot \widehat{p} \\ \widehat{p} &=& \frac{\exp(X\widehat{\beta})}{1 + \exp(X\widehat{\beta})} \end{eqnarray} \]
Visualizing the model
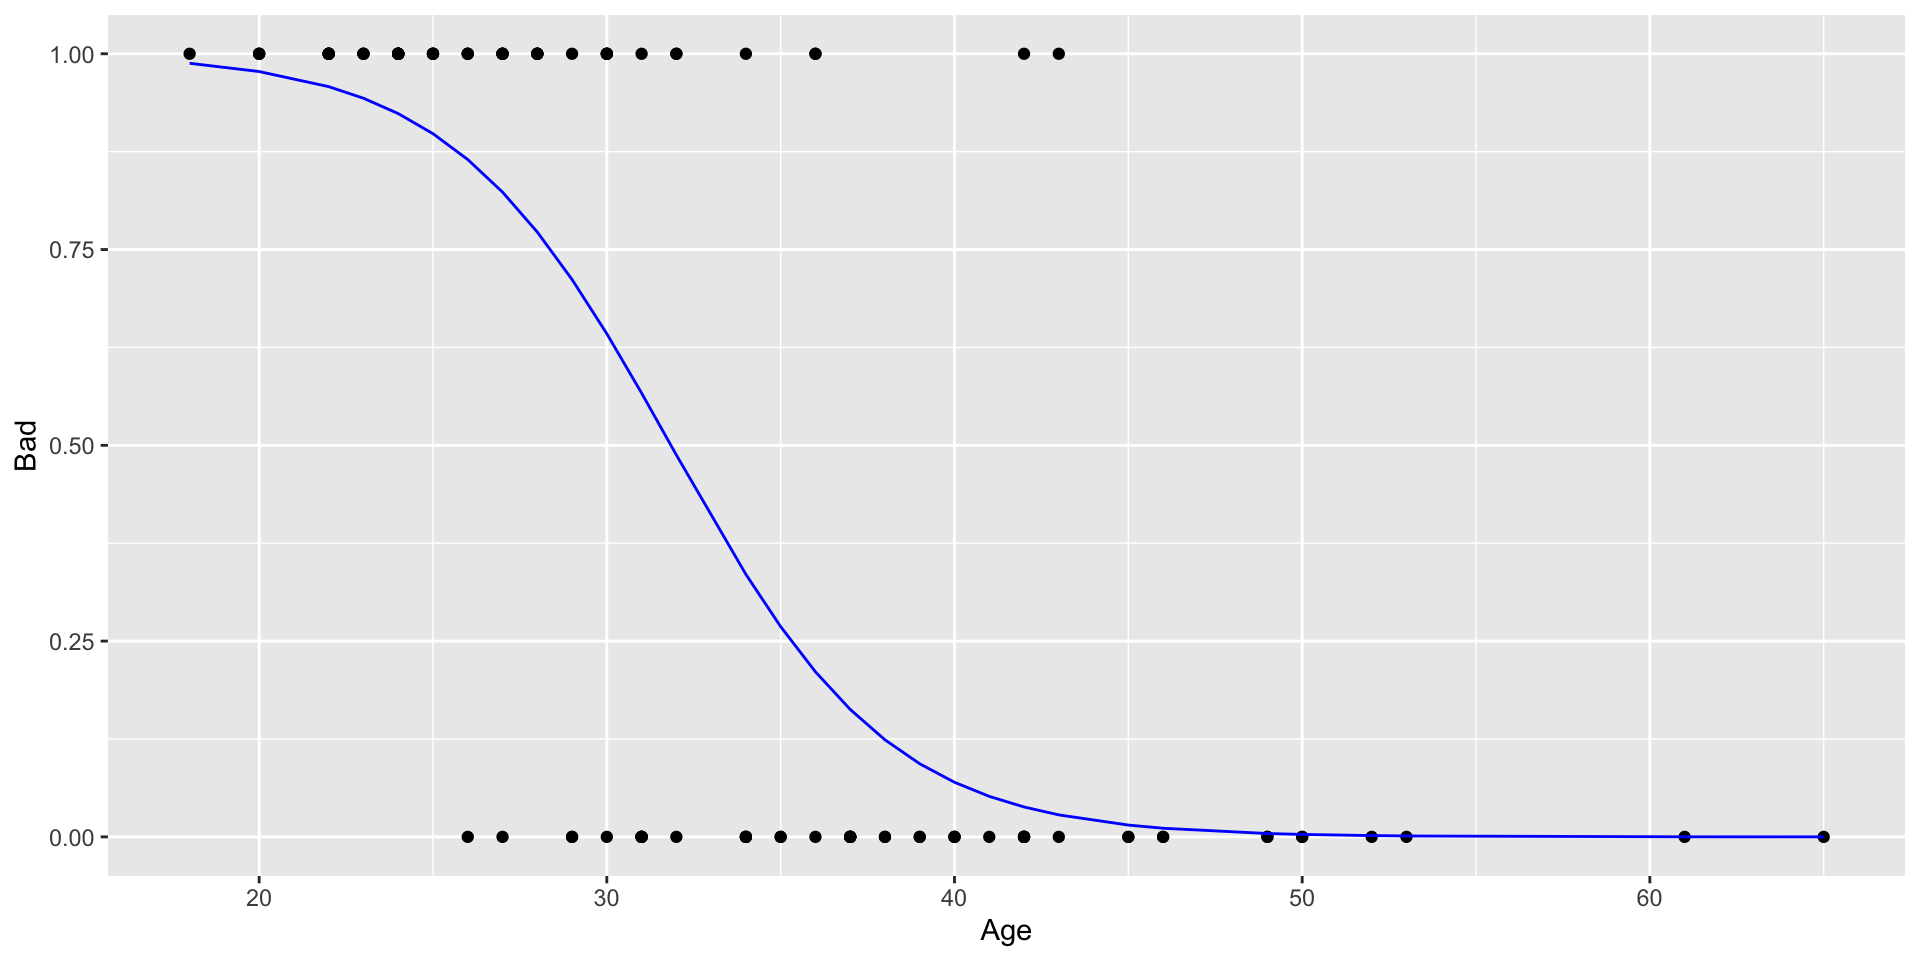
- How to interpret this curve?
- The blue line is \(\widehat{p(\text{Bad})}\), given the
Age.
Interpreting the coefficients
Our prediction equation is:
\[ \log(\text{odds}) = \log\left(\frac{\widehat{p(\text{Bad})}}{1-\widehat{p(\text{Bad})}}\right) = 10.12 -0.32 \cdot \text{Age} \]
Let’s start with some basic, but not particularly useful, interpretations:
When
Age= 0, we predict that the log odds will be 10.12, so the probability of a bad status is predicted to be 100% (a customer with zero age is not meaningful).When
Ageincreases by 1 year, we predict that the log odds of having a bad status will decrease by 0.32.Instead of log odds is better to have the interpretation in odds.
Interpreting the coefficients
Let’s rewrite the prediction equation as:
Predicted odds of a bad status, \(\exp(10.12 -0.32 \cdot \text{Age})\).
Increasing age by 1 year will multiply the odds by \(\exp(-0.32) = 0.73\); i.e., decrease the odds by 27.22%.
In summary, \[(\exp(\widehat{\beta}) - 1)\times 100 = \text{percentage change in odds}.\]
Increasing age by 2 years will multiply the odds by \(\exp(2\cdot-0.32) = 0.53\); i.e., decrease the odds by 47.03%.
Odds equal to 1 indicate an one-to-one chance.
Making predictions
- What is the probability of having a bad status given the customer has an age of 35.
- Using the probability equation in R:
\[ \widehat{p(\text{Bad})} = \frac{\exp(10.12 -0.32 \cdot 35)}{1+ \exp(10.12 -0.32 \cdot 35)} = 0.27 \]
Adding more predictors
Adding another predictor: can we do better?
Just like with a linear regression model, we can add additional predictors to the model (for example,
Other_Credit).Our interpretation of the coefficients in multiple logistic regression is similar to multiple linear regression, in the sense that each coefficient represents the predicted effect of one \(X\) on \(Y\), holding the other \(X\) variables constant.
How good is our model?
- Unfortunately, the typical root mean squared error, RSE metric isn’t available for logistic regression.
- However, there are many metrics that indicate model fit.
- But: most of these metrics are difficult to interpret, so we’ll focus on something simpler to interpret and communicate.
Accuracy of the model
We could use our model to make a prediction of Status based on the probability.
Suppose we say that our prediction is: \[ \text{Prediction} = \begin{cases} \text{Bad}, & \text{if $\widehat{P(\text{Bad})} \geq 0.5$}, \\ \text{Good}, & \text{if $\widehat{P(\text{Bad})} < 0.5$}. \\ \end{cases} \]
Given a threshold of 0.5, now we can compute the fraction of accounts whose status we correctly predicted.
For Bad and Good accounts.
This is known as the accuracy of the model.
Accuracy of the model
We can use the
xtabsfunction to get the accuracy:We add we the number of correctly predicted groups for both Bad and Good, and divide by the total of observations.
              Status
predict.Status Bad Good Sum
          Bad   43   10  53
          Good   7   40  47
Sum 50 50 100- Correctly predicted that is Good - 40
- Correctly predicted that is Bad - 43
- Total number of accounts in the sample - 100
- The accuracy is (40 + 43)/100 = 0.83, or 83%
Confusion Matrix
- The table from
xtabsis also called a Confusion matrix
| Actual failure | Actual success | |
|---|---|---|
| Model predicts failure | True negative | False negative |
| Model predicts success | False positive | True positive |
- True positives: predicting Bad for an account that is Bad
- True negatives: predicting Good for an account that is Good
- False positives: predicting Bad for an account that is Good
- False negatives: predicting Good for an account that is Bad
- If we had designated Good as 1 and Bad as 0, these would have switched
- So Accuracy = (True negative + True positive)/(Total cases)
Accuracy of the model
Suppose that the Amazon is trying to build a model to predict which customers buy a certain product:
Suppose that 0.01% of people are customers of this product (the product is really expensive / high revenue)
A “null” or “no-brainer” model that predicts that no one is a customer will be 99.99% accurate.
The revenue coming from our model would be zero.
But the model could make two different kinds of prediction errors:
False positive: predicting someone is a customer when they really are not
False negative: predicting someone is not a customer when they really are
These two measures give us a better idea of the predictive power of our model.
False positive rate
The false positive rate is the proportion of actual failures where the model predicted success.
              Status
predict.Status Bad Good Sum
          Bad   43   10  53
          Good   7   40  47
Sum 50 50 100- False Positives - predicting an account is Bad when it really is Good
- Actual failure - number of cases that are Good
- False positive rate = False positives/ Actual failure
- In our model, the false positive rate is 10/50 = 0.2
False negative rate
The false negative rate is the proportion of actual successes where the model predicted failure.
              Status
predict.Status Bad Good Sum
          Bad   43   10  53
          Good   7   40  47
Sum 50 50 100- False Negatives - predicting an account is Good when it really is Bad
- Actual success - number of cases that are Bad
- False negative rate = False negatives/ Actual success
- In our model, the false negative rate is 7/50 = 0.14
Changing rates
How do we reduce false positive/negative rates?
- Instead of using 50% as a cutoff probability to decide when to predict success, use a higher (or lower) probability.
- For example, we could have the model predict that an account is Bad only if \(\widehat{p(\text{Bad})} \geq 0.8\), instead of 0.5:
              Status
predict.Status Bad Good Sum
          Bad   32    2  34
          Good  18   48  66
Sum 50 50 100- Accuracy = (48+32)/100 = 0.8
- False positive rate = 2/50 = 0.04
- False negative rate = 18/50 = 0.36
Prediction Trade off
We can decrease the false positive rate, but at the expense of increasing the false negative rate.
Or we can decrease the false negative rate, but at the expense of increasing the false positive rate.
We might choose a cutoff probability other than 50% based on our assessment of the relative costs of the two different kinds of errors.
For the bank, approving a customer who later has a
Badaccount (a false negative) may be more costly than turning away a customer who would have beenGood(a false positive).
Summary
In a logistic regression model, the response variable is binary, taking values of either zero or one.
The model estimates the log odds of the event associated with a response of one.
The model’s effects are interpreted in terms of odds.
Predictions are expressed as probabilities.
The performance of the model is evaluated based on its prediction accuracy.
