Call:
lm(formula = eval ~ beauty + gender, data = profs)

Residuals:
     Min       1Q   Median       3Q      Max
-1.87196 -0.36913  0.03493  0.39919  1.03237

Coefficients:
            Estimate Std. Error t value             Pr(>|t|)
(Intercept)  3.88377    0.03866  100.47 < 0.0000000000000002 ***
beauty       0.14859    0.03195    4.65           0.00000434 ***
gendermale   0.19781    0.05098    3.88              0.00012 ***
---
Signif. codes:  0 '***' 0.001 '**' 0.01 '*' 0.05 '.' 0.1 ' ' 1

Residual standard error: 0.5373 on 460 degrees of freedom
Multiple R-squared:  0.0663,    Adjusted R-squared:  0.06224
F-statistic: 16.33 on 2 and 460 DF, p-value: 0.0000001407Data Science for Business Applications
Class 04 - Categorical Variables
Categorical predictors with 2 categories
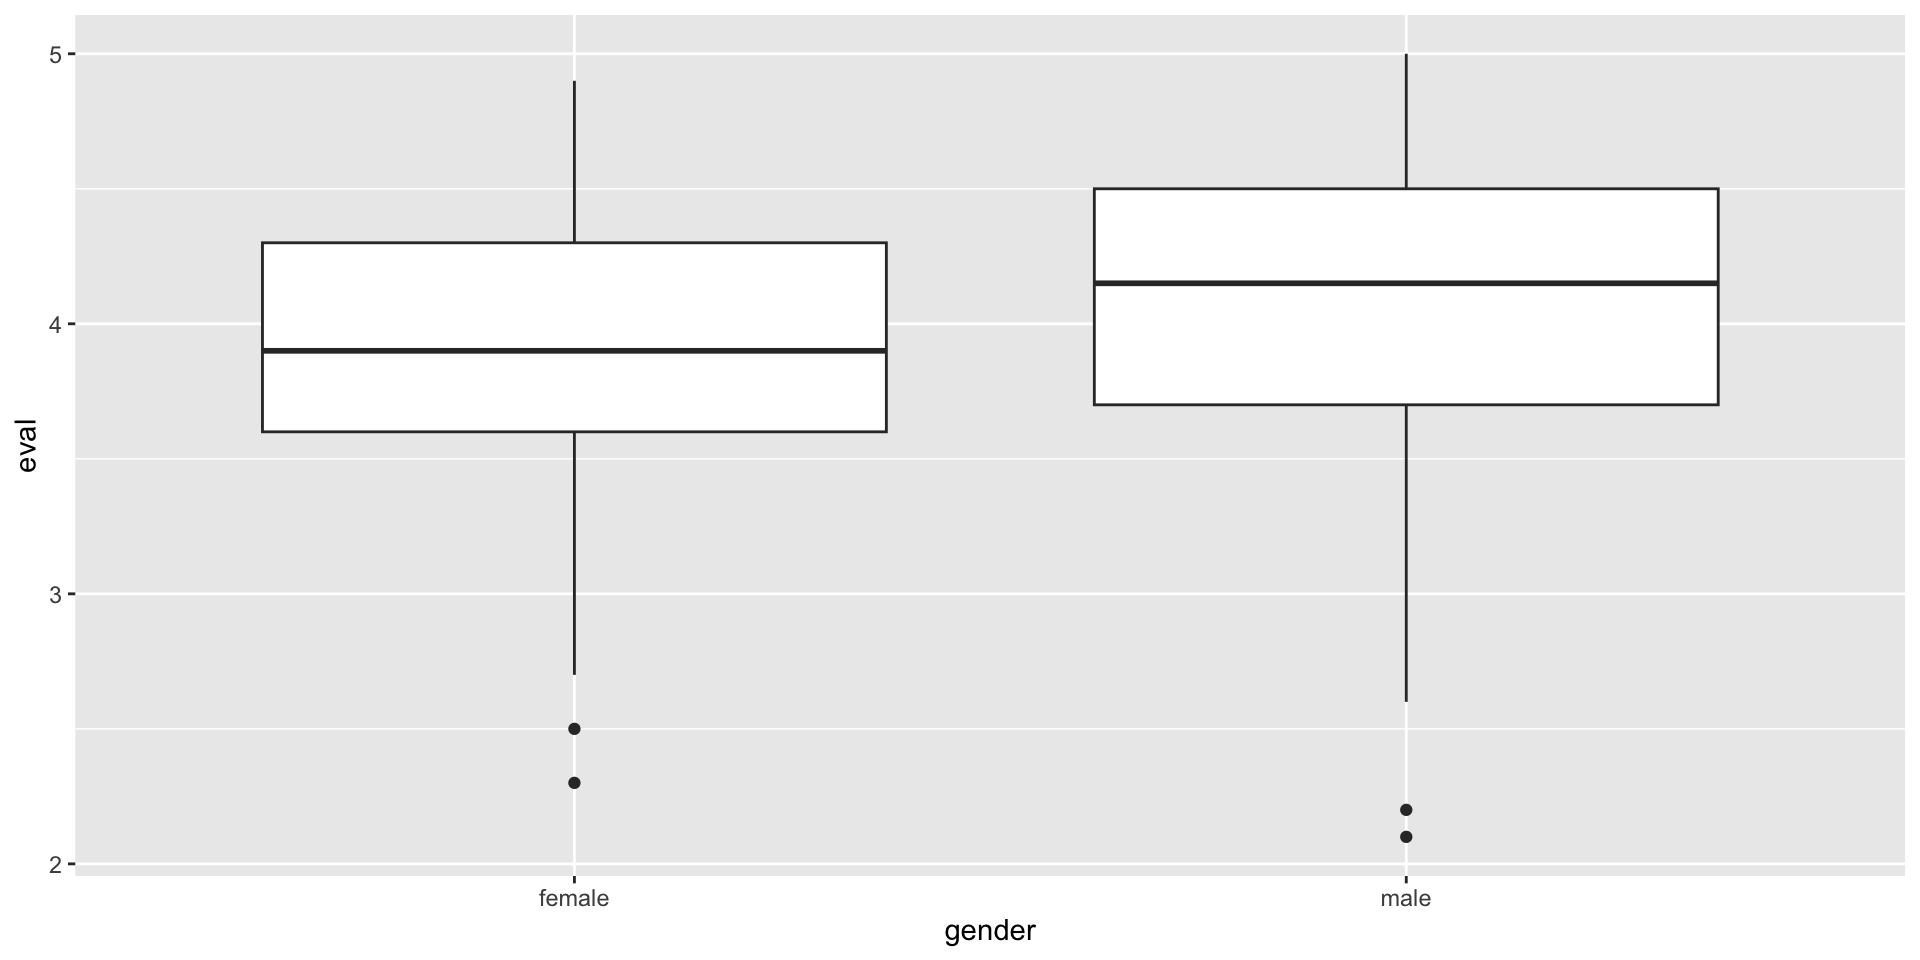
What’s the impact of gender on student evaluations?
Incorporating gender into the multiple regression model
The model is given by: \[ \texttt{eval} = \beta_0 + \beta_1 \cdot \texttt{beauty} + \beta_2 \cdot \texttt{gender} + \epsilon \] Where we have that:
\(\texttt{eval}\): is the response variable - (numerical)
\(\texttt{beauty}\): is a predictor - (numerical)
\(\texttt{gender}\): is a predictor - (categorical) - two groups:
femalemale
Incorporating gender into the multiple regression model
- Gender is a categorical variable (male or female in this data set) so we can’t use it as-is as a predictor.
- Idea: Recode gender into the quantitative variable 1 = male, 0 = female.
- R does this for us!
- The ordering is totally arbitrary! If you put a categorical variable into a model, R will arbitrarily pick one category or the other as the “1” category, and make the other the “0” category.
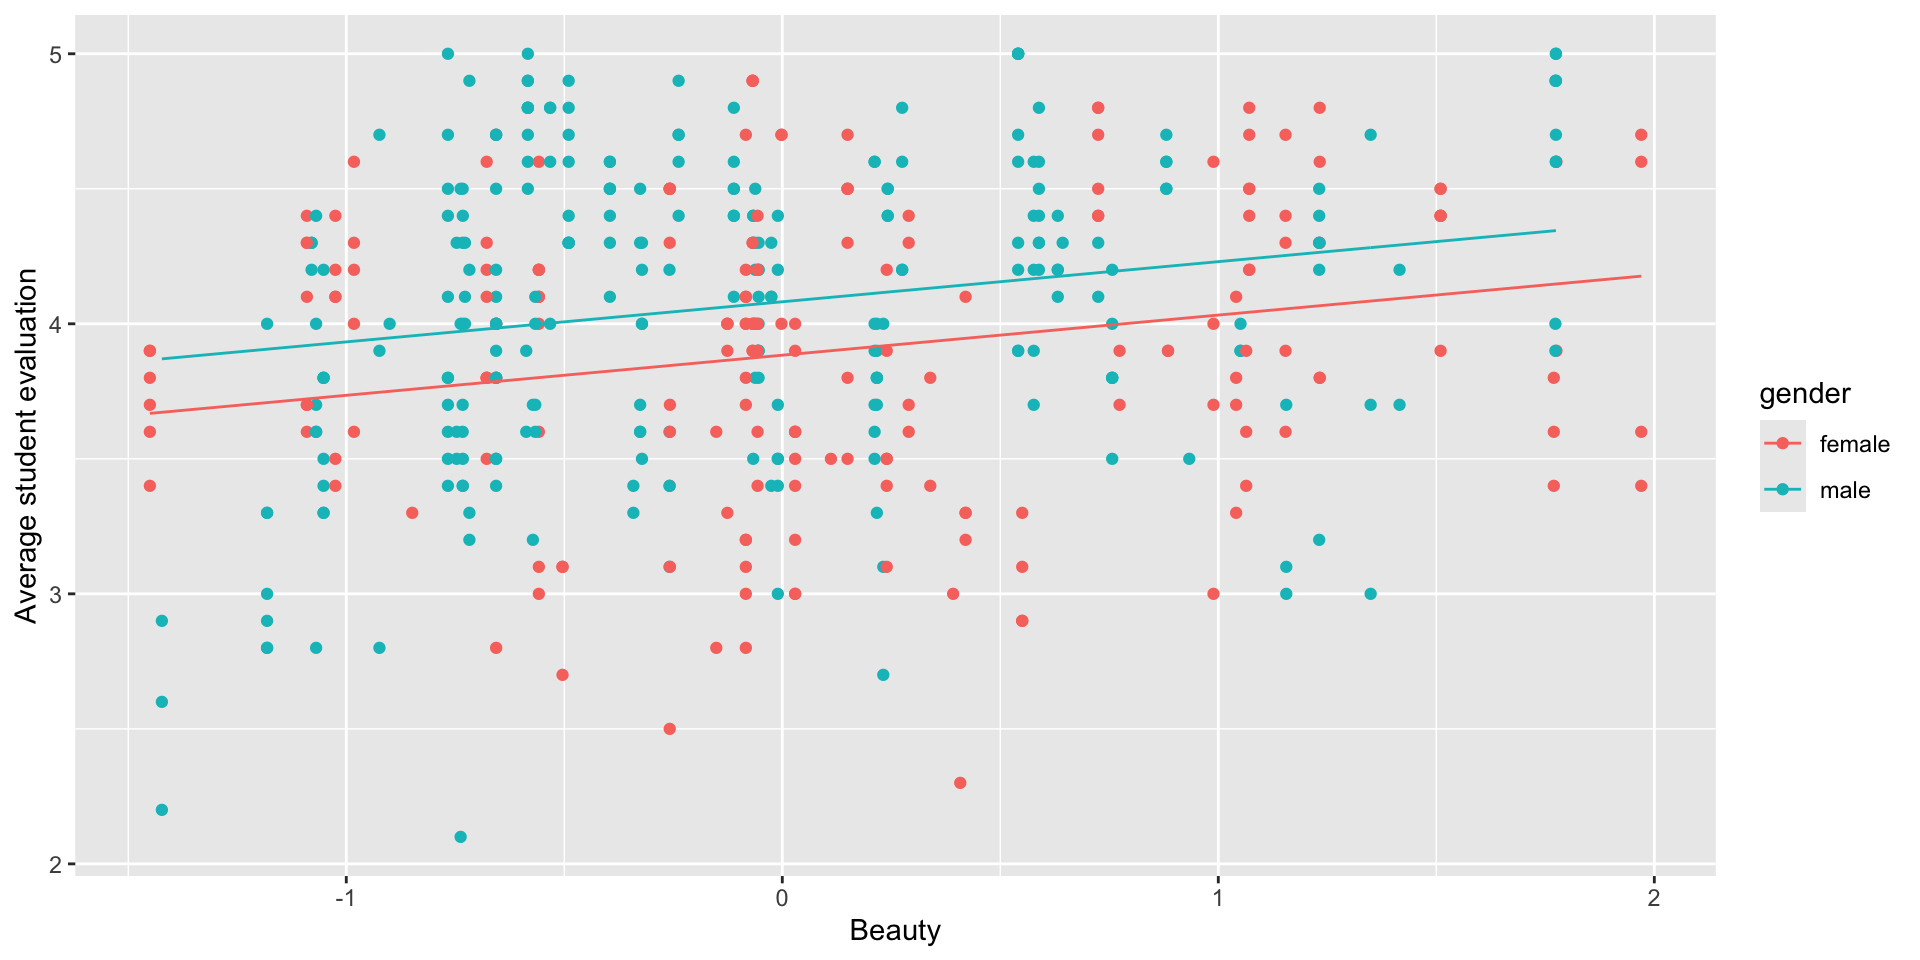
Run the Regression Model
Regression a model using gender
A multiple regression predicting evaluation score from beauty and gender effectively fits two parallel regression lines:
Categorical predictors with 3+ categories
Is there a generation gap?
- The variable
generationis eithersilent(born before 1945),boomer(born 1945-1964), orgenx(born after 1965). - Is generation a significant predictor of evaluations above and beyond
genderandbeauty? - To answer this, we need a model that includes as predictors all of
gender,beauty, andgeneration. - But we can’t just create a variable that is 0 for the silent generation, 1 for baby boomers, and 2 for gen X—why not?
- Solution is to pick a “reference category” and create dummy variables for the other categories.
OK boomer
Let’s arbitrarily pick boomers as a reference category:
| Category | genx |
silent |
|---|---|---|
| Boomers | 0 | 0 |
| Gen Xers | 1 | 0 |
| Silent Gens | 0 | 1 |
R will do this automatically when you add a categorical variable with 3+ categories to a regression (it will arbitrarily pick a reference category)!
Run the Regression Model
Call:
lm(formula = eval ~ beauty + gender + generation, data = profs)

Residuals:
     Min       1Q   Median       3Q      Max
-1.91613 -0.36042  0.03609  0.42282  1.04398

Coefficients:
                 Estimate Std. Error t value             Pr(>|t|)
(Intercept)       3.89727    0.04403  88.521 < 0.0000000000000002 ***
beauty            0.14021    0.03304   4.243            0.0000267 ***
gendermale        0.22230    0.05345   4.159            0.0000382 ***
generationgenx   -0.02831    0.06149  -0.460               0.6454
generationsilent -0.16292    0.07992  -2.039               0.0421 *
---
Signif. codes:  0 '***' 0.001 '**' 0.01 '*' 0.05 '.' 0.1 ' ' 1

Residual standard error: 0.536 on 458 degrees of freedom
Multiple R-squared:  0.07477,   Adjusted R-squared:  0.06669
F-statistic: 9.253 on 4 and 458 DF,  p-value: 0.0000003386
Analysis
All else equal (i.e., among professors of the same gender and beauty):
- Gen X professors are predicted to get scores that are 0.03 points below those of boomers.
- Silent gen professors are predicted to get scores that are 0.16 points below those of boomers.
- Only the boomer/silent generation difference is statistically significant; Gen X professors are not significantly different than boomers.
- In other words: age only seems to matter if you are really old.
![]()